

loja online
agendamentos
eventos
pop-up

- 10%
Area Chart
Por
Area Chart and Graph for Data Visualization
Ainda não há avaliações
Período gratuito de 14 dia(s)




Visão geral de Area Chart
- Show trends at a glance: turn rows of numbers into an area chart your visitors read easily
- Keep your data current: type values in the settings panel, or feed the chart from a JSON link or Velo code
- Compare series: add several lines to one chart and give each a solid or dashed stroke
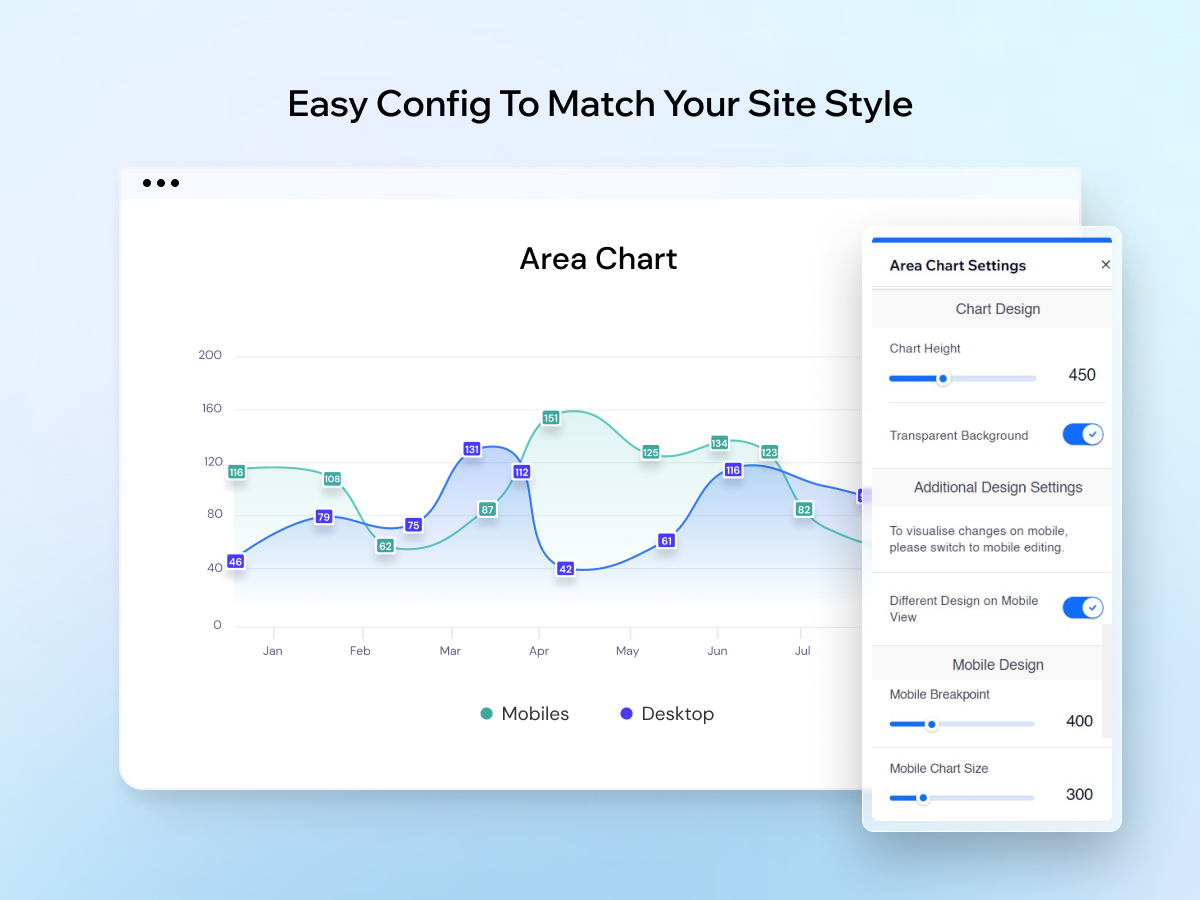
- Match your design: adjust the chart style so the graph fits the look of your brand
Classificações e avaliações
Este aplicativo ainda não recebeu nenhuma avaliação. Seja a primeira pessoa em avaliá-lo.Preços e planos
Este aplicativo oferece um período gratuito de 14 diasPlano Premium
- 10%
$
1
34
/mês
$149
Showcase Your Line Charts With Ease
Various Types of Area Charts
Easy Config To Match Your Site Style
* O preço está em USD.
* Esta promoção é válida até 21 de outubro de 2026 às 23:59 UTC. O desenvolvedor do app reserva-se o direito de encerrar a promoção a qualquer momento, e os termos da promoção podem estar sujeitos a alterações.